Trading Journal & Copy Precision Monitor
TradeBridge includes professional-grade diagnostic and analytics tools built directly into the Control Center interface. Rather than treating order copying as a black box, TradeBridge provides total execution transparency.
Local Logging: All execution details are recorded locally in your TradeBridge directory under journal/executions-YYYY-MM.jsonl. No personal trade data is uploaded to cloud servers.
Quantower Journal Sync: To ensure absolute accuracy of realized PnL, commissions, and execution tracking on Quantower follower accounts, TradeBridge automatically reconciles trade records directly with Quantower's historical trade database 5 seconds after any position change (opening, scaling, or closing) is detected.
1. Built-in Trading Journal
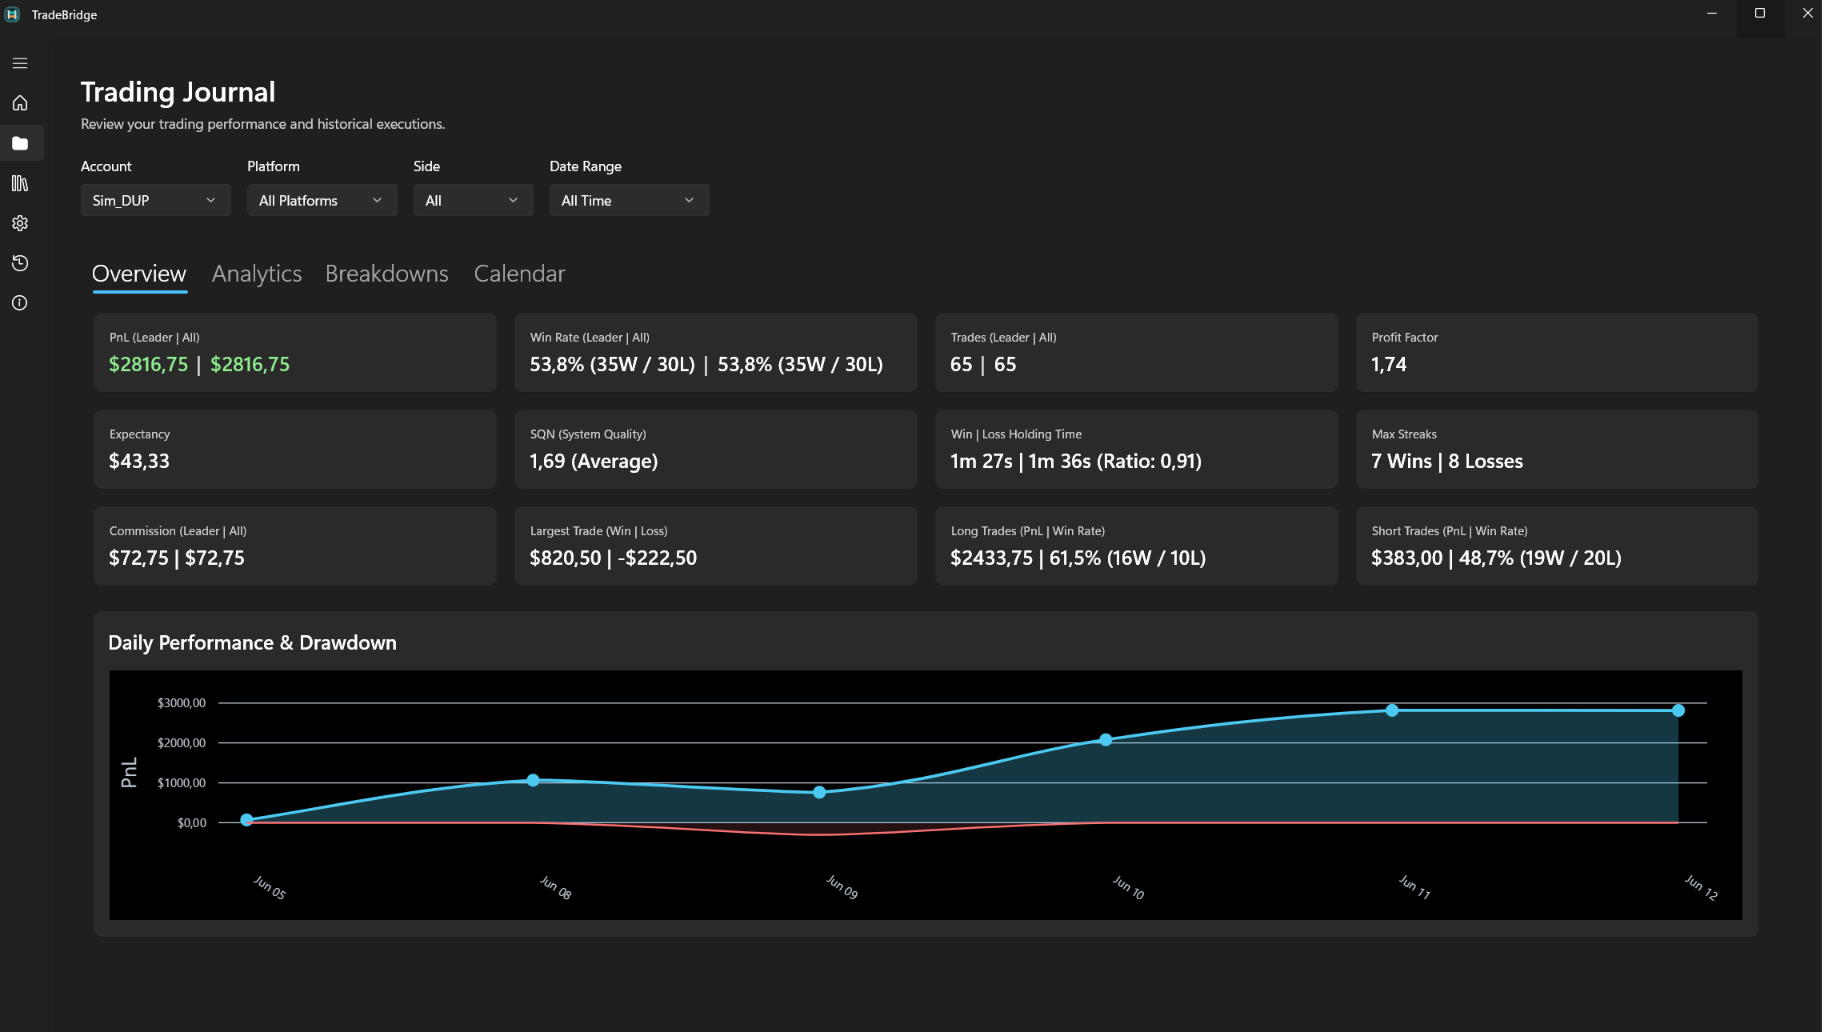
The Control Center's Journal page aggregates and calculates performance metrics across all connected leader and follower accounts. You can review your cumulative performance and filter it on the fly.
Filtering & Performance Metrics
Filter your statistics by Account, Platform (NinjaTrader 8 or Quantower), Side (Buy/Sell), and Date Range (Today, Yesterday, This Week, This Month, All Time). The journal calculates:
- Net PnL: Gross realized profits/losses minus commissions. Displays Leader stats alongside All Account totals.
- Win Rate: Detailed breakdown of winning vs. losing trades and total trade count.
- Profit Factor: Gross profits divided by gross losses. A standard industry metric of trading efficiency.
- Total Commissions: Calculated automatically using broker execution records.
- Largest Win/Loss: Shows your single largest win and single largest loss.
- Long/Short Stats: Breakdown of PnL, win rates, and win/loss count specifically for Buy (Long) and Sell (Short) trades.
Performance Distributions (Charts)
TradeBridge renders dynamic performance graphs inside the Control Center using native charting:
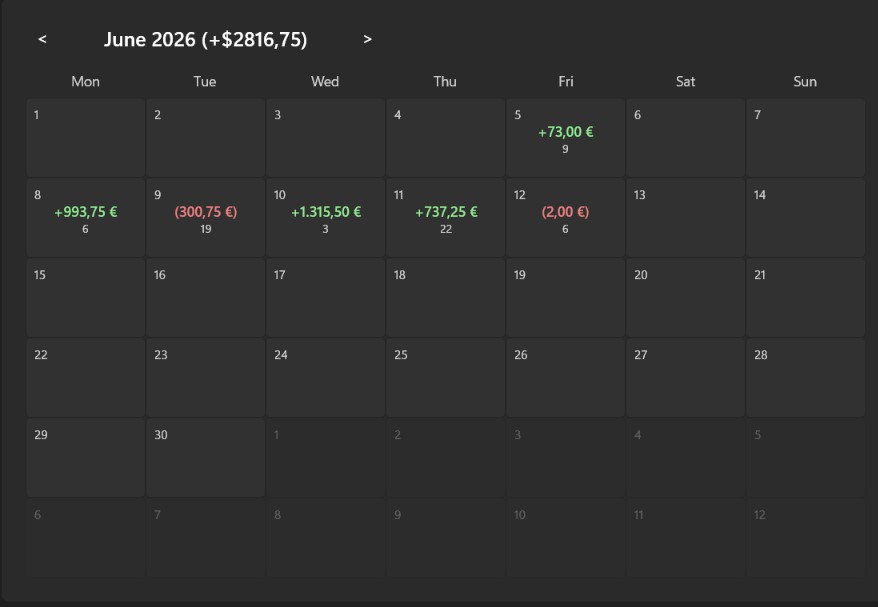
- Daily Performance & Drawdown: A line/area chart showing cumulative PnL and drawdown over time.
- PnL by Day of Week: Tracks which days (Monday through Friday) are your most profitable.
- PnL by Hour of Day: Identifies your performance distribution across trading hours (New York time).
- PnL by Instrument: Bar graph showing performance breakdown by futures contract or crypto asset.
- Trades by Side & Platform: Pie charts showing allocation between long/short trades and NinjaTrader/Quantower executions.
Grids & Execution Logs
- Account Breakdown Grid: A table listing each account, total trades, total contract volume, gross PnL, commissions, and net PnL. Great for comparing multiple prop firm accounts.
- Symbol Breakdown Grid: A summary table listing traded instruments, contracts, gross/net PnL, and commissions.
- Execution History: A clean list of all trades showing date, account, instrument, side, order type, quantity, execution price, commission, and realized PnL.
2. Latency & Order Tracker
To verify that your copier is running correctly, TradeBridge includes a dedicated Latency & Order Tracker. It tracks local copy timing, platform/broker acknowledgements, in-book duration, order state, and fill/slippage details when the platform reports them.
Metrics Tracked
- Copy Send / Copy Delay: The local time between the leader event and follower copy dispatch as observed by TradeBridge. This is not an exchange timestamp; it is the copier/platform timing available locally.
- Broker Response: The time reported between local submission and the platform/broker acknowledgement when that timestamp is available.
- In Book: How long the order stayed working before a final state such as Filled, Cancelled, or Rejected when the platform emits enough order state data.
- Median Slippage: The median price difference (in points/ticks) between the leader's fill price and the follower's fill price.
- Quantity Ratio (%): Tracks whether the follower filled the expected amount of contracts based on your multiplier and symbol scale. For example, if the leader filled 1 NQ and the follower is configured to copy x1.0, the quantity ratio is 100%.
Slippage Calculation Details
Market fills can happen in stages (partial fills, scale-ins, scale-outs). To calculate slippage accurately without distorting metrics, TradeBridge employs a clustering algorithm:
- Signal ID Matching: If the trading platforms assign a unique
SignalId, leader and follower fills are linked directly. - Proximity Clustering: For executions without a signal ID (or partial fills), the engine groups executions by Instrument, Side, and a 30-second time window.
- VWAP Calculation: The engine calculates the Volume Weighted Average Price (VWAP) for the leader cluster and the follower cluster:
VWAP = Σ(Price × Quantity) / ΣQuantity
- Slippage Output: Slippage is calculated as:
- Buy/Long Trades: Leader VWAP - Follower VWAP
- Sell/Short Trades: Follower VWAP - Leader VWAP